
Dashboard and results
The Tracker dashboard and the Results page: net and net EV, net showdown and net non-showdown curves, your rake, winrate in bb/100, tournament ROI, rakeback, and what it takes for your tournament winnings to show.
The Dashboard sums up your results, the Results page details them. Both follow the hero, the format and the limits chosen at the top of the menu.
The dashboard
This is the page the Tracker opens on. Its period is set at the top of the “Results” card and is remembered.
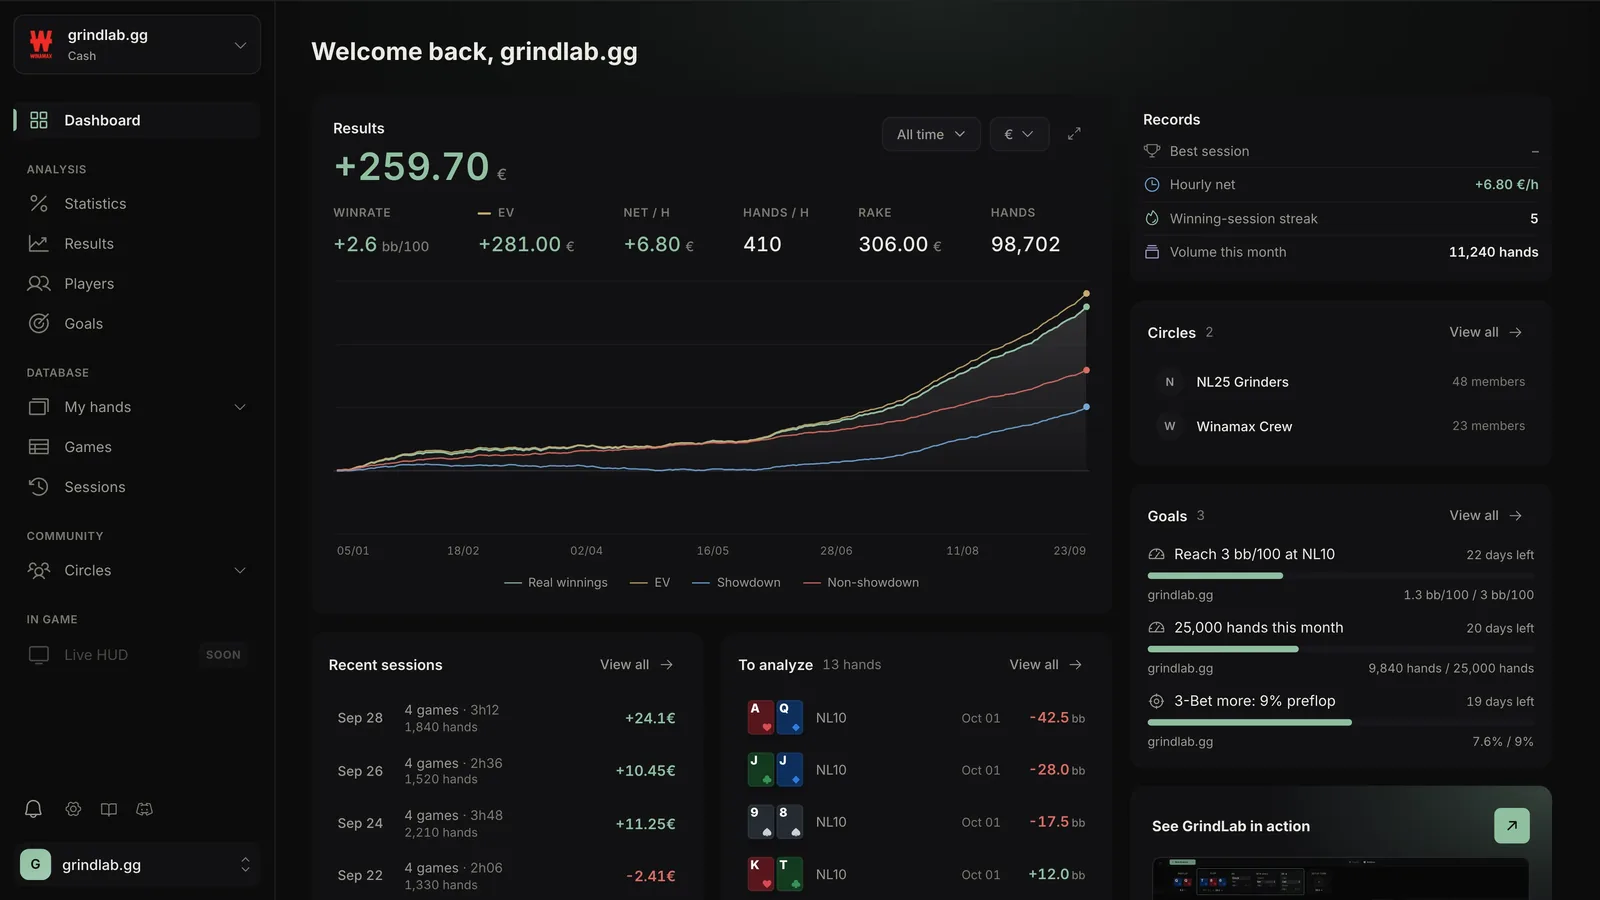
- Results: the period's winnings, key figures and curve; expanding it opens the Results page
- Records in cash, Deep runs in tournaments, Winnings by multiplier in spins
- Recent sessions, To analyze (the last five hands set aside for the Lab), an activity calendar, your Circles and your Goals
Hiding your financial results
The small switch to the right of the “Results” title hides your amounts across the whole dashboard: net, net EV, net per hour, your rake and the nets of recent sessions and records turn to asterisks. Winrate in bb/100, ROI, ITM and volumes stay readable, and the curve keeps its shape without its figures. Hovering the switch shows “Hide financial results”. The switch only shows in the € view: in BB or chips nothing is hidden, and your choice comes back as soon as you switch to € again. It is also remembered from one launch to the next.
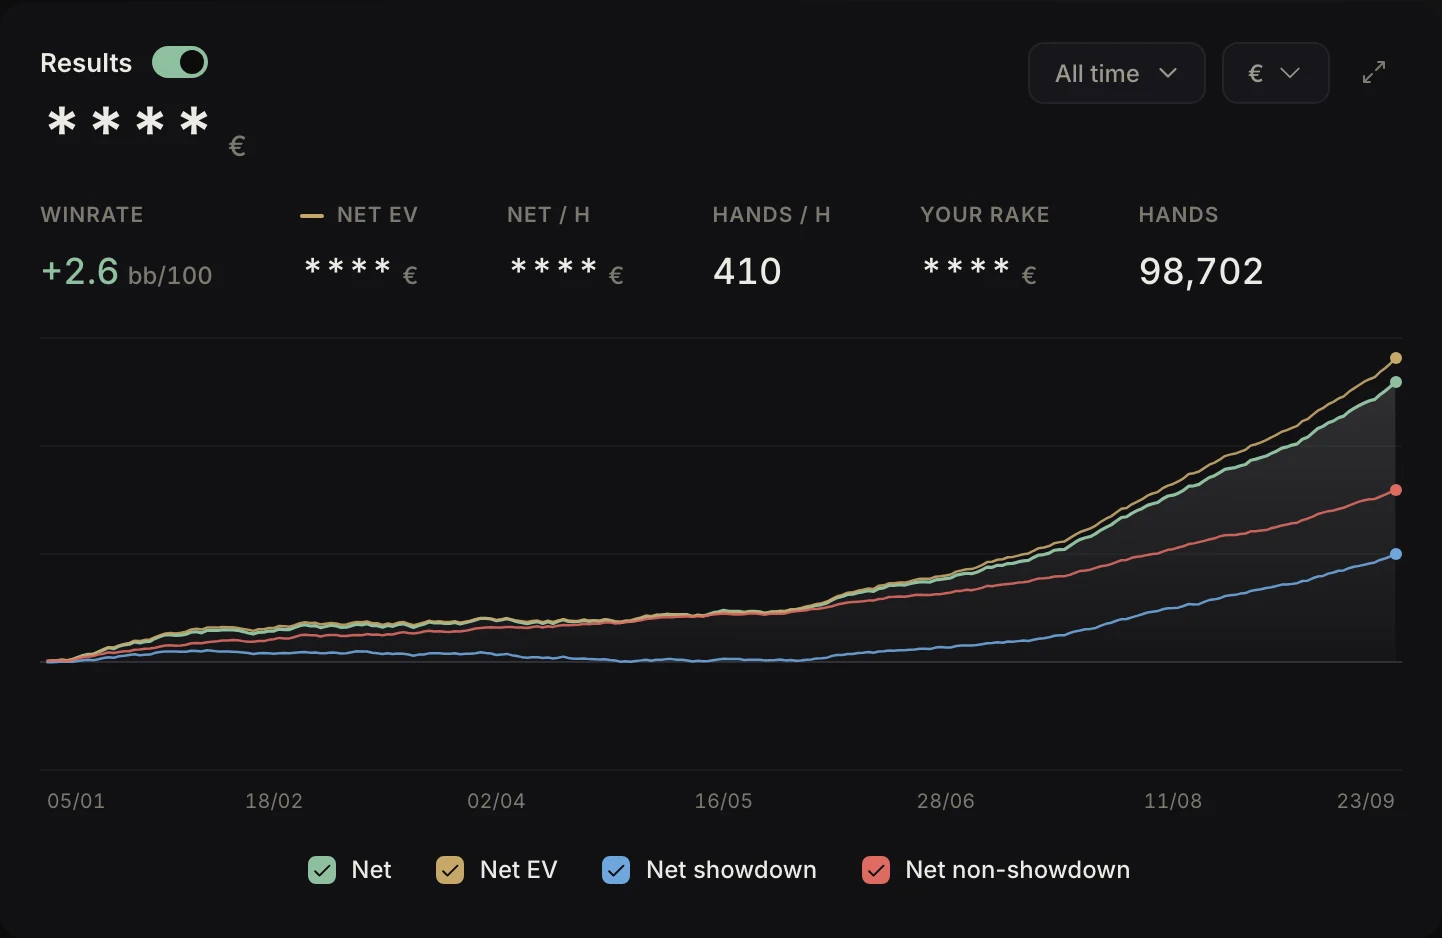
When streamer mode already hides amounts, the switch stays on and cannot be turned off.
The Results page
The curves, on the same scale:
- Net and Net EV (the same net, with the luck of all-ins taken out)
- Net showdown and Net non-showdown: what you win when the hand goes to showdown, and without going there
- Your rake, in cash: your share of the rake of the pots you played. Where that share is not known, the curve shows the “Table rake”.
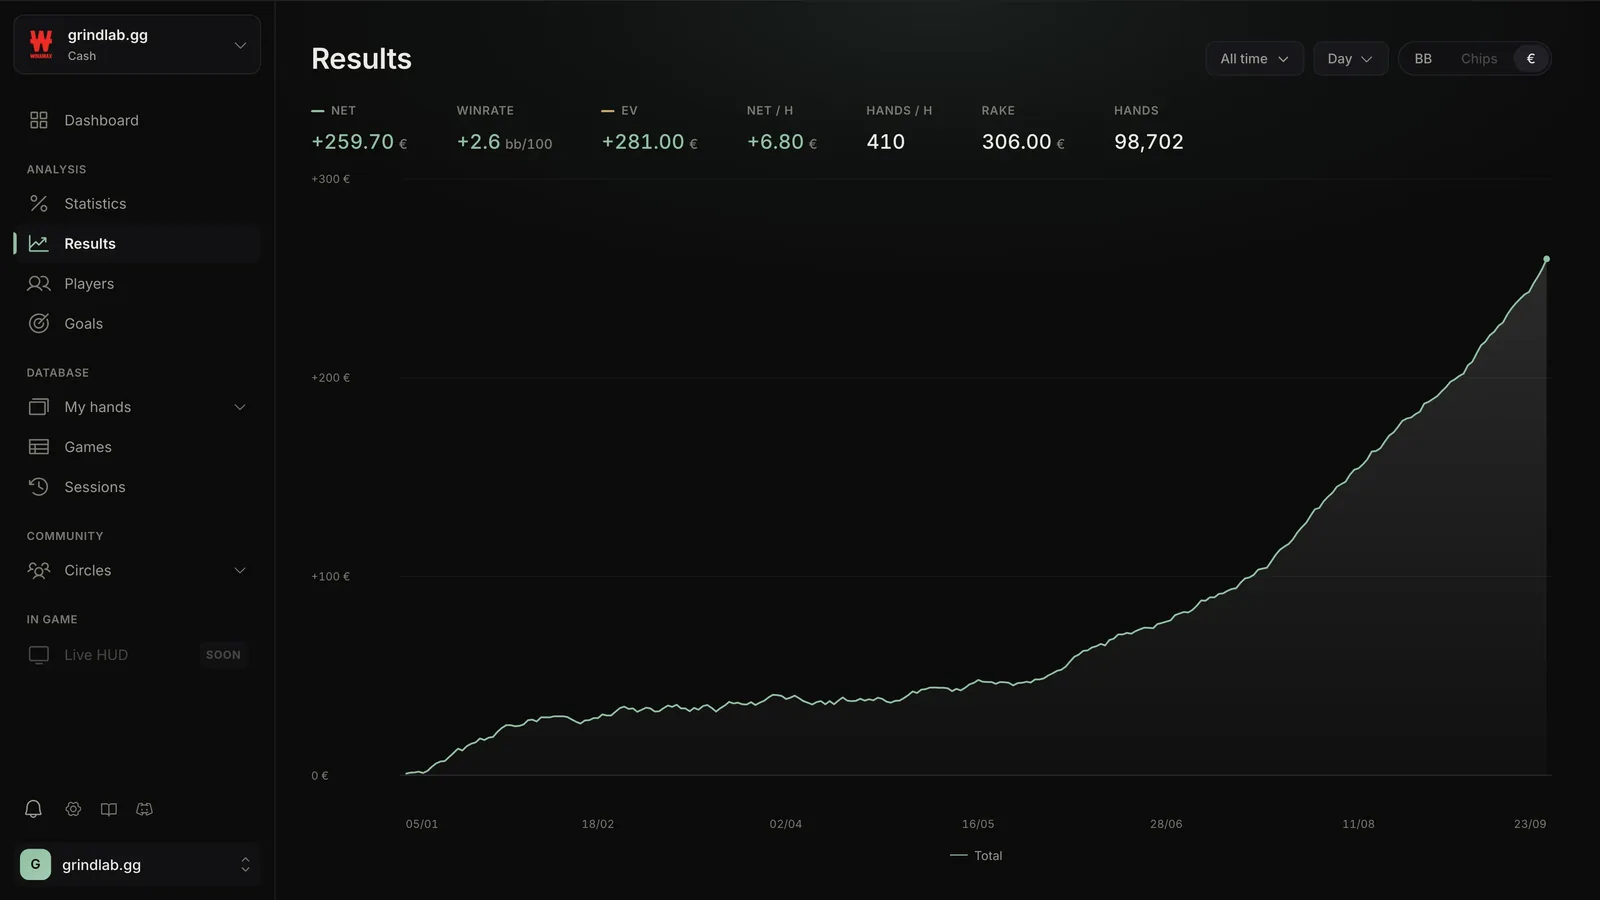
The legend under the chart is a row of checkboxes: untick a curve to hide it, and the choice is remembered.
The settings:
- “Display by”: hand, day, week or month
- “Unit”: BB, Chips (outside cash) or €. In €, one curve per hero plus a total, in a single currency. In tournaments, € comes from game results: no hand-by-hand display. The unit is remembered per format.
- the period, including “Last 24 hours” and “Last 48 hours”, which do not cut a session at midnight
Above the curves, the key figures for the period, by default:
| View | Figures |
|---|---|
| Cash | Net, winrate, net EV, net / h, hands / h, your rake, rakeback, hands |
| Tournament and spin, in BB | Winrate, winrate EV, winrate showdown, winrate non-showdown, hands |
| Tournament and spin, in chips | Net, net EV, net showdown, net non-showdown, hands |
| Tournament and spin, in € | Net, ROI, average buy-in, gross winnings, cost, games |
A name never changes meaning: Net is a total (in BB, € or chips), Winrate a rate in bb/100, and "EV" added to either means "with the luck of all-ins taken out". How they are computed: The winnings figures.
Choosing your key figures
The settings button, right of the unit (BB, Chips, €), opens "Choose the key figures": tick a figure to add it, untick it to remove it, drag it by its grip to change the order (with the keyboard: the grip, then ↑ or ↓). Eight figures at most; once eight are shown, the other boxes are greyed out.
The choice belongs to each context: cash, then tournament and spin, each in BB or chips on one side and in € on the other. On top of the default figures, you can add:
| View | Extra figures |
|---|---|
| Cash | Winrate EV, net showdown, net non-showdown, best session, main stake, rakeback (with no rate set, an "i" next to its name opens Settings › Tracker) |
| Tournament and spin, in BB or chips | Best day, worst day |
| Tournament in € | ITM, final tables, wins, field beaten, best result, entries |
| Spin in € | Wins, best result, entries |
The dashboard's Results card follows your choice: the first figure shows large, then the ones that fit on one line. The live session's Curve tab shows the first five. "Reset" brings back the default figures.
Reading the curves
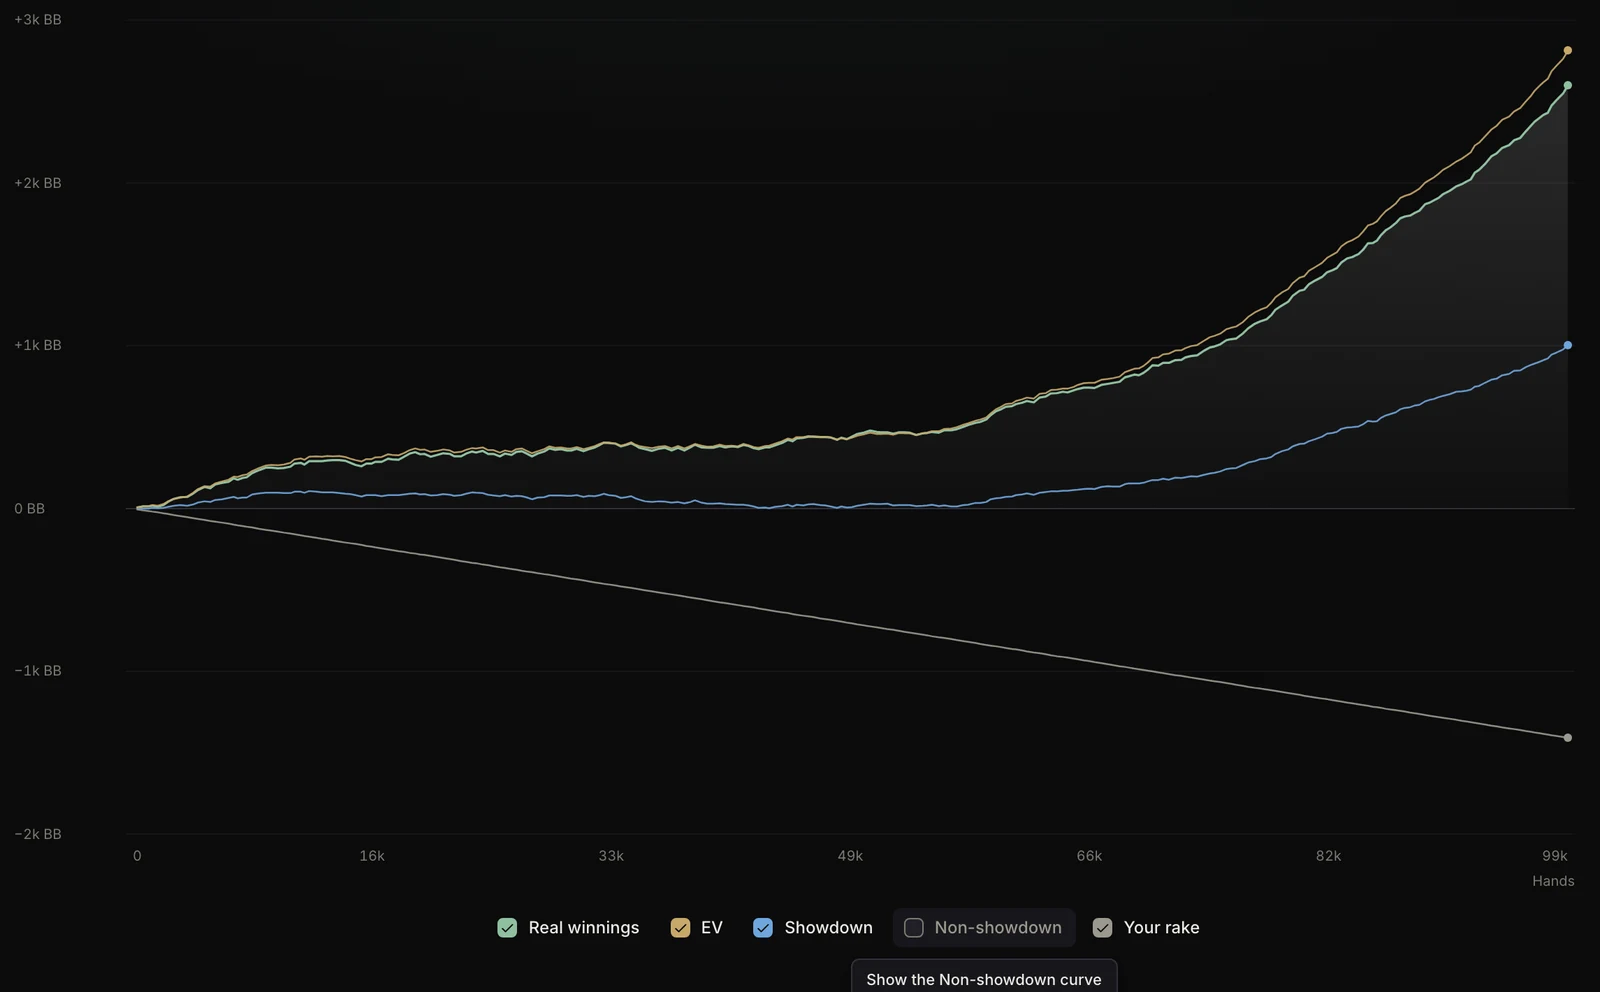
- Net below net EV for a long time: you lost more all-ins than expected, that is variance. Above it: you ran well. All-in with 80% equity, EV credits you with 80% of the pot (the calculation).
- Strongly negative net non-showdown: often play that is too passive, or too many folds against aggression.
- Winrate in bb/100: over 10,000 hands, variance still leaves a swing of several bb/100. Judge the trend over 50,000 hands.
Tournament winnings
In tournaments and spins, winnings in euros come from the room's result files, not from the hands.
| Room | Where the results come from |
|---|---|
| Winamax, PokerStars, Unibet, PMU | Delivered with the histories. Games without a result: add the summaries folder, which is not always the hands folder |
| Betclic | The hand history text export, to import |
| iPoker | The session XML export, to import |
| GGPoker, CoinPoker, ACR | None: your winnings there cannot be proven and the curve does not count them |
When games stay without a result, the page names the room.
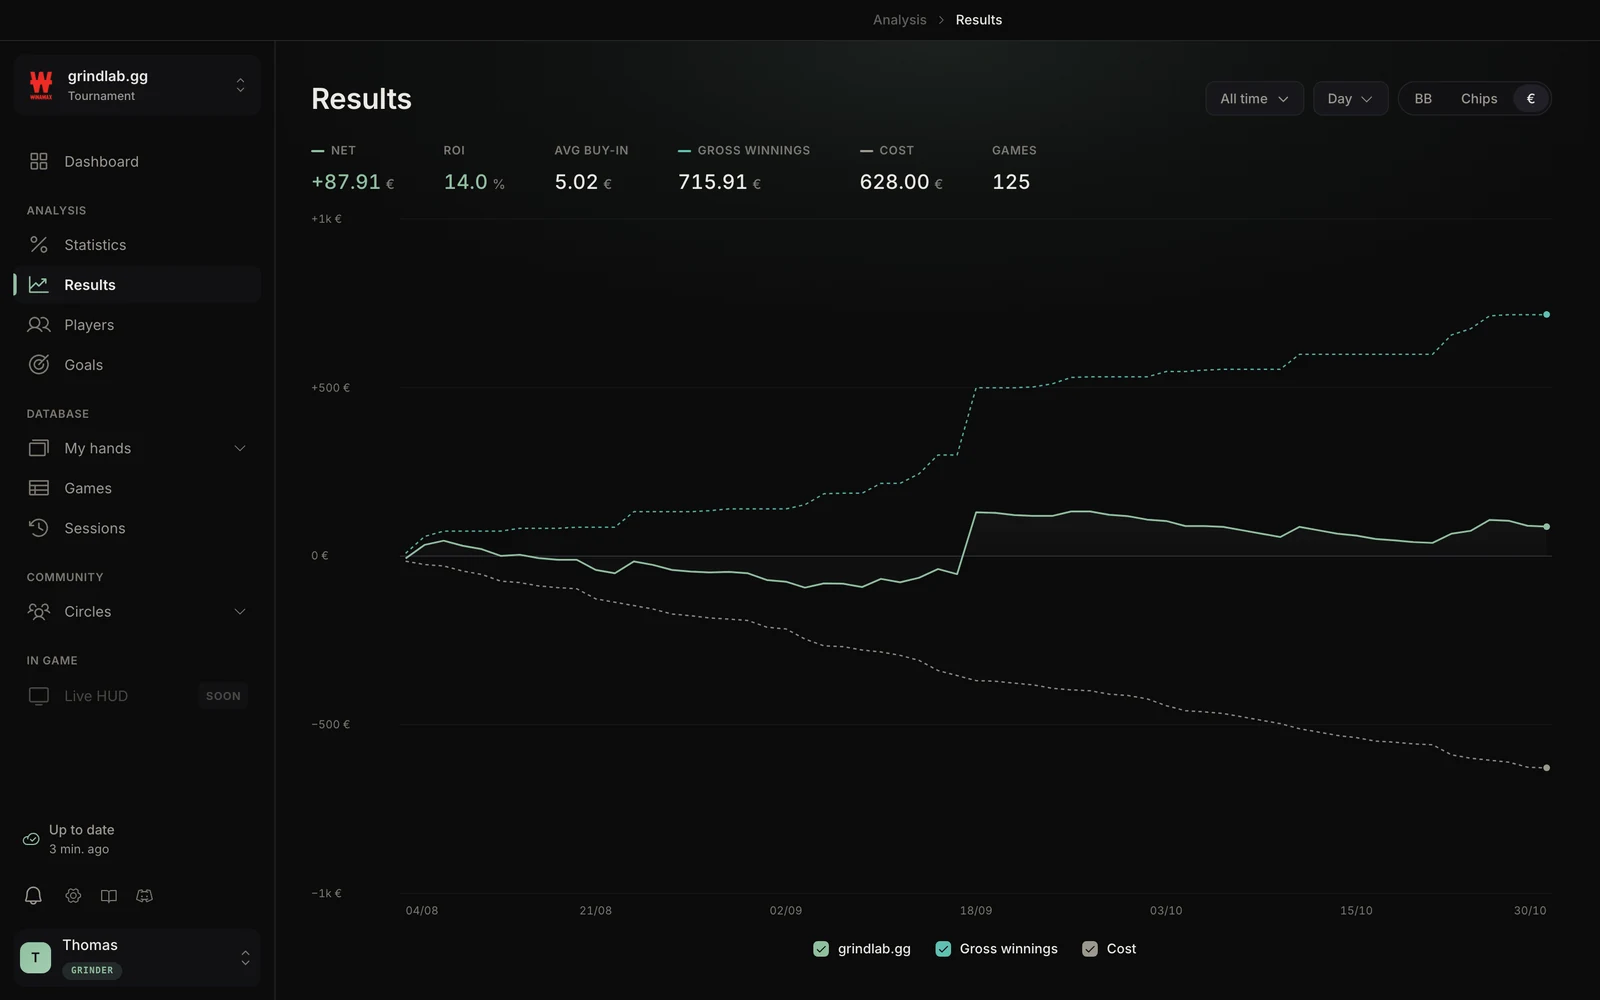
The cost includes rebuys and add-ons, a multi-day event counts as one tournament, and freerolls are left out of the ROI: see Tournament figures.
Rakeback
Enter your rates in Settings › Tracker (one for spins, one for cash); they stay on your computer. In spins, the dashboard shows the entry fees × your rate. In cash, Results shows your rake × your rate: your share of each pot's rake, in proportion to what you put in, the base most rooms use.
On the Free plan
The Tracker shows the last 30 days, in BB, hand by hand, with the winnings curve alone; the other figures are blurred. Changing the period, the unit or a curve opens the Grinder plan presentation.