
Read your poker stats: 20+ preflop and postflop metrics in GrindLab
You probably know your VPIP runs a little high. Or that you fold too much to c-bets. But "probably" isn't data, it's an impression built from the last ten sessions you happen to remember, inevitably skewed toward the hands that stuck with you. Fixing a real leak needs a number computed across your whole history, not your memory of it.
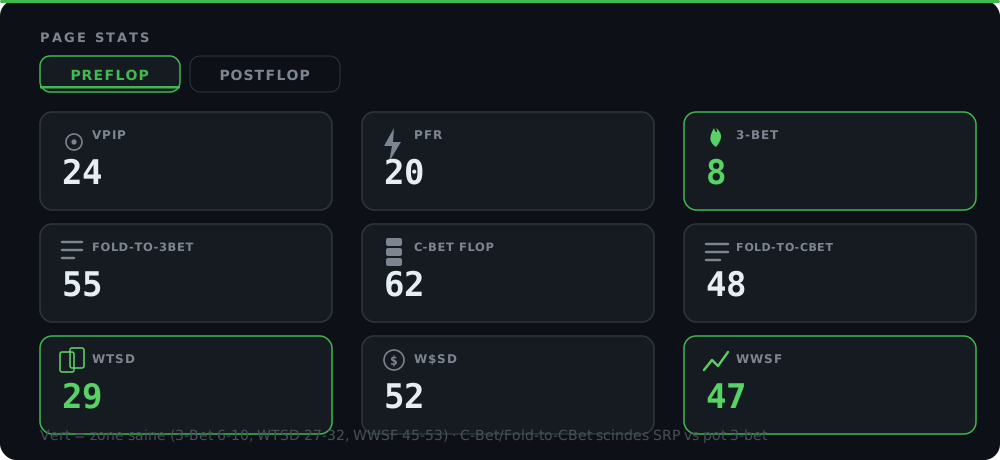
GrindLab has a dedicated Stats page, on the web app and the desktop tracker, showing 20+ Level-0 metrics split into two grouped tabs: PREFLOP and POSTFLOP. It stays instant even when your database holds millions of hands, because it never rereads your raw hands. This article breaks down what each stat measures, where the healthy benchmarks sit, and why a couple of metrics are duplicated depending on pot context.
A page that stays fast at millions of hands
The first thing to understand is how the page holds its speed. Scanning millions of hand rows on every load to recompute a percentage would be far too slow, and it's exactly the kind of wall most trackers hit as their history grows. GrindLab avoids that by maintaining precomputed aggregate tables: every time you import hands, the counters (opportunities, occurrences, frequencies) update in the background. The Stats page then just reads those already-ready totals.
The practical result: whether your base holds ten thousand hands or several million, the page loads instantly. You never pay a price for a growing history. It's the same underlying logic that powers the winnings and EV curves: read aggregates instead of replaying every hand on every load.
Two grouped tabs: Preflop and Postflop
The page used to be organised around a single global tab that mixed everything together. That's been removed in favour of a strict two-tab structure, each with its own grid of tiles:
- PREFLOP: the decisions before the flop, hand selection and raise aggression.
- POSTFLOP: what happens after the flop, plus outcome stats (showdown, overall aggression).
Every tile has its own icon, so you can scan the grid visually without reading each label. It's built for a quick pass at the end of a session: open the page, sweep both tabs, and spot the outlier before you dig further.
Table: the main stats and what they measure
| Stat | Tab | Definition | Computed on |
|---|---|---|---|
| VPIP | Preflop | Voluntarily Put $ In Pot: how often you enter voluntarily (call or raise) preflop | hands dealt |
| PFR | Preflop | Pre-Flop Raise: how often you raise preflop | hands dealt |
| 3-Bet | Preflop | How often you re-raise an opponent's raise | 3-bet opportunities |
| Fold to 3-Bet | Preflop | How often you fold after open-raising and getting 3-bet | 3-bet-against opportunities |
| 4-Bet | Preflop | How often you re-raise an opponent's 3-bet | 4-bet opportunities |
| C-Bet flop | Postflop | Flop continuation-bet frequency as the preflop raiser | c-bet opportunities, split SRP / 3-bet pot |
| Fold to C-Bet | Postflop | How often you fold to a flop c-bet | facing-c-bet opportunities, split SRP / 3-bet pot |
| WTSD | Postflop | Went To Showdown: how often you reach showdown | hands seen at the flop |
| W$SD | Postflop | Won $ at Showdown: how often you win the pot at showdown | hands that reach showdown |
| WWSF | Postflop | Won When Saw Flop: how often you win the pot after seeing the flop | hands seen at the flop |
This table covers only the headline stats. The full grid runs past 20 tiles, but these are the ones that carry the most signal for a first diagnosis.
Context matters: SRP vs 3-bet pot
The single most important detail on the page, the one that separates a genuinely exploitable stat from a hollow number, is the context split. C-Bet flop and Fold to C-Bet are each shown twice: once for the single-raised pot (SRP), once for the 3-bet pot.
Why the duplication? Because these are two radically different situations. In an SRP, the preflop raiser's range is wide: it holds hands of every strength, and a 65-70% c-bet is standard on most textures. In a 3-bet pot, the 3-bettor's range is already tightened and often polarised. A 70% c-bet in that context doesn't read the same way, because the population of hands behind the number isn't the same.
Merging the two into a single average would erase that signal. A player who c-bets 90% in SRP but only 40% in 3-bet pots has a far more precise profile to exploit than a player showing a flat "65%". It's the same principle that makes the Villain Tracker in the Lab useful: context turns a raw number into a decision-relevant one.
Spot the leak in your own stats
The healthy reference bands
Three verified benchmarks are worth memorising so you can place yourself without comparing against an external database:
- 3-Bet: a frequency between 6 and 10% is considered healthy. Below that, you're probably letting too many attacking spots against an open pass. Above it, your 3-bet range is probably too wide to stay balanced against a player who 4-bets you correctly.
- WTSD: a frequency between 27 and 32% sits in the normal range. A high WTSD (past 35%) often signals you're paying off too many marginal rivers. A very low WTSD can signal the opposite: you're giving up too many hands that should have gone the distance.
- WWSF: a frequency between 45 and 53% (average around 48%) is a good sign. Below that, you're losing the hand too often after seeing the flop, which can come from a c-bet that's too passive, a fold-to-c-bet that's too high, or hand selection that's too loose earlier in the hand.
These bands aren't absolute laws (style, format and opponent skill all play a role), but they're solid reference points for a first pass.
Build your poker instincts. Practice equity and pot odds decisions in real time
Try it free →Turning a number into something to work on
A stat on its own says nothing until you read it against the others. Here are three typical readings.
High VPIP, low PFR: too many calls
A large gap between VPIP and PFR (say VPIP 32, PFR 14) signals you're entering pots by calling rather than raising. It's the kind of leak preflop stats make visible at a glance, while it's nearly invisible playing hand by hand. The fix belongs upstream, in the work you do on opening ranges, not something you patch in real time at the table.
High Fold to C-Bet in SRP
If your Fold to C-Bet in SRP runs well past 55-60%, you're probably too exploitable against a standard c-bet: any opponent who c-bets every time books an automatic profit off you. The fix is more defense (floats, selective check-raises), not a preflop change.
High WTSD but low W$SD
A high WTSD combined with a low W$SD signals you reach showdown often but rarely win once you're there: you're paying off rivers you lose more than average. It's one of the clearest signals to tighten your river calling range, and a good starting point for a targeted review session in My Hands.
Where these numbers fit in your work
The Stats page is a starting point, not an endpoint. Once a number raises a flag, the next step is going back to the actual hands behind it. That's where the general approach to studying poker picks up: spot the leak via the stat, then dig into the real hands in the Lab to understand the spots making up that percentage.
This kind of reading pairs well with the rest of the GrindLab tracker: the live HUD surfaces similar benchmarks at the table in real time, your BB/100 winrate curve tells you whether you're winning, and the Stats page tells you why. The desktop tracker and the web app share the same base, so whether you import hands after the fact or play with the tracker running live, the numbers stay consistent. You can also download the tracker if you want these stats kept up to date continuously while you play.
Limits to keep in mind
- Level-0 only. These 20+ stats cover base frequencies (general preflop and postflop). They don't replace a precise spot analysis: two players with the same VPIP can have very different styles depending on the composition of their range.
- Sample size. A 3-Bet or WWSF computed on 50 hands means almost nothing. The larger the sample, the more reliable the number, especially for stats built on rare opportunities like 4-Bet.
- Scoped to your hero identity. The numbers reflect only the hands played under the name you selected. If you play under multiple identities or formats, check which one is active.
Conclusion
GrindLab's Stats page turns a vague impression ("I think I fold too much") into a verifiable number, split across two clear tabs and readable even on a base of several million hands. The detail that changes everything is the context split on C-Bet and Fold-to-C-Bet: without it, you'd be reading an average that masks two different populations of hands.
Two habits worth building:
- Always compare against a band, not a round number. 3-Bet at 6-10%, WTSD at 27-32%, WWSF at 45-53%: these are zones, not exact targets.
- A stat outside the norm is a starting point, not a conclusion. Go back to My Hands to see the spots that make up the number before you change your strategy.
Open the Stats page, switch between the two tabs, and spot the biggest gap. That's your next thing to work on.