
Villain Tracker in the Lab: Reading Opponent VPIP, PFR and 3-Bet
EV calc in the Lab answers one question: what is villain's range? The closer the range you set is to the real player, the more usable the EV you read. The catch is that setting a range means knowing the player. And until now that lived in your head or in a separate HUD.
GrindLab now shows each opponent's stats right next to their seat in the Lab replayer: VPIP, PFR and 3-Bet, computed from your own imported hands. You open a hand, you immediately see who you're up against, and you set the range accordingly. This article explains where the numbers come from, how to read them, and how to turn them into a decision.
Where the stats come from
No external database, no third-party datamining. The stats are computed from your own imported hand histories in GrindLab.
When you replay a hand in the Lab, the replayer sends a request to /api/player-stats with three pieces of information:
- The villain names at the table (by normalised position: CO, BTN, etc.)
- Your hero name (to scope the search to your hand base)
- The date of the analysed hand
The server pulls every hand of that opponent from your history, aggregates his preflop actions, and returns his frequencies. It's your personal track record against that player, turned into numbers.
Time-aware: no information leak
Important detail: the query filters on playedAt < the hand's date. You only see the stats you would have known before playing the spot. The hand you're analysing is never included, and no future hand either.
This is deliberate and it matters for review. If you replay a session in order, a regular's stats grow hand after hand, exactly the way your read sharpened live. You judge your decision with the information actually available at that moment, not with hindsight.
Reading the stats row
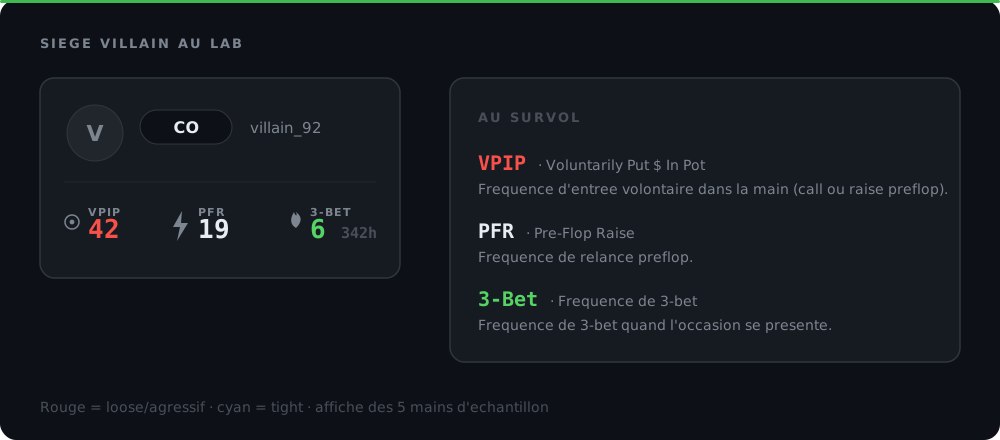
Under each villain's position pill (the hero has no row, you know your own game), a compact row shows three stats with an icon each, plus the sample hand count on the right:
| Stat | Icon | Definition | What it's computed on |
|---|---|---|---|
| VPIP | eye | Voluntarily Put $ In Pot | hands he calls or raises preflop / hands dealt |
| PFR | lightning | Pre-Flop Raise | hands he raises preflop / hands dealt |
| 3-Bet | flame | 3-Bet frequency | 3-bets / 3-bet opportunities |
3-Bet is relative to opportunities (there was a raise in front of him), not total hands. That's the standard HUD definition: a player who 3-bets 8% does it 8% of the times he gets the chance, not 8% of all his hands.
The counter on the right (for example 342h) is the sample. Always read it before concluding.
The colour coding
The numbers colour at the extremes to draw the eye to the exploitable:
- VPIP: red if > 40 (very loose), cyan if < 20 (very tight)
- PFR: red if > 30, cyan if < 12
- 3-Bet: red if > 12
White is the normal zone. Red says "this player is wide or aggressive on this axis", cyan says "this player is tight". You don't need to read three numbers: the colour gives you the profile at a glance.
On hover
Hover over the row: a tooltip unfolds the full label of each stat and a short definition. Handy when you come back to a session and want to re-read a profile without mixing up metrics.
When stats don't show
Three cases where the row stays empty, by design:
- Fewer than 5 hands. The row only shows from a 5-hand sample with that player. Below that, the number would be pure noise.
- Hand pasted with no hero. If you pasted a hand anonymously, with no hero name, the app can't scope the query to your base. Import via file to keep identities.
- Mobile. On small screens, the stats row is hidden to keep the table readable. The tracker is built for desktop review.
While loading, the row's slot is reserved (the table doesn't jump when the stats land).
Turning a profile into a decision
Stats are worthless if you don't turn them into a range. Here are three typical profiles and the matching adjustment in the Lab.
The loose-passive (VPIP 45 / PFR 12 / 3-Bet 3)
He enters a lot of pots but raises little and almost never 3-bets. His postflop continuing range is wide and weak.
Adjustment: widen his calling range in the Lab, apply the Value filter when he puts money in (when he raises, it's real), and value-bet thinner against his calls. Your bluffs lose value (he calls too much): cut them. The EV breakdown will show the showdown branch carries the profit, not fold equity.
The nit (VPIP 16 / PFR 14 / 3-Bet 4)
He plays few hands but raises most of the ones he plays. Tight, strong range.
Adjustment: tighten his range to the top in the Lab. Against his aggression, fold more: his 3-Bet at 4 is almost exclusively value. Your bluffs gain fold equity preflop (he folds a lot), but cost dearly when he continues. Steal his blinds wide, pay him off tight.
The aggressive 3-bettor (VPIP 26 / PFR 22 / 3-Bet 13)
3-Bet in red: he attacks opens. His 3-bet range is polarised, full of bluffs.
Adjustment: 4-bet bluffing becomes profitable, and so does calling your open against his 3-bet (his range holds too much air). Set him a wide 3-bet range in the Lab and look at the EV of your 4-bet: against a 13 3-bettor it often flips positive where it would be negative against a 5.
Limits to keep in mind
- Sample. Five hands is enough to display, not to conclude. VPIP and PFR stabilise within a few hundred hands; 3-Bet needs many more, because opportunities are rare. Always weight by the
hcounter. - Preflop stats only. The tracker covers VPIP, PFR and 3-Bet. It says nothing about postflop tendencies (cbet, fold-to-cbet, river aggression). That's still on you and the hand replay.
- Your history, not his full one. The numbers reflect the hands you played against him. A regular you cross rarely will have a small sample even if he's played tens of thousands of hands elsewhere.
Conclusion
The villain tracker brings together two things that lived apart: reading the opponent and computing EV. Before, you set a range on instinct. Now you read VPIP/PFR/3-Bet next to the seat, you infer the profile, you set the range, and the verdict computes on it. All in one window, with numbers pulled from your own hands and honest on the time axis.
Two habits to build:
- Import via file to keep identities: that's what feeds the tracker.
- Read the colour before the number, the sample before the conclusion. Red and cyan give you the profile at a glance; the
hcounter tells you how much to trust it.
Import a recent session from My Hands, open a hand against a player you know, and watch the stats row appear under their seat. You still set the range, but now you set it informed.
The method in 6 steps
Import your hands with real names
The tracker needs player identities. Import your hand histories from your room (Winamax, Unibet, PokerStars, etc.): villain names and your hero name are preserved. Hands pasted anonymously via copy/paste don't feed the tracker.
Open a hand in the Lab from My Hands
Go to My Hands, pick a hand from a session against players you've faced before, and send it to the Lab. The replayer loads the table and fires the stats request in the background.
Read the stats row under each villain seat
Under each opponent's position pill (not the hero), a compact row shows VPIP, PFR and 3-Bet with an icon each, plus the sample hand count on the right (e.g. 342h). The row only appears from 5 hands.
Hover for detail
Hover over the stats row: a tooltip gives the full label of each stat (VPIP = Voluntarily Put $ In Pot, PFR = Pre-Flop Raise, 3-Bet = 3-Bet frequency) and a short definition. Useful to re-read a profile without confusion.
Spot the exploitable colours
A red VPIP (>40) flags a very loose player: thinner value, fewer bluffs. A cyan PFR (<12) flags a passive who calls a lot and raises little: isolate wide, value-bet thin. A red 3-Bet (>12) flags an aggressive 3-bettor: 4-bet bluffs and wider calls become profitable.
Adjust villain's range in the Lab
Translate the profile into a continuing range. Against a VPIP 45 / PFR 12 (loose-passive), widen his calling range and apply the Value filter. Against a nit (VPIP 16), tighten his range to the top and fold more to his aggression. The EV verdict recomputes on the range you set.